

The Differentness/Sameness Matrix
Thinking Aloud – a Perspective on Assessing the Level of Differentiation and its Value in the Marketplace
I’ve been doing some reading lately (a thank you to DR for the recommendation on Play Bigger: How Pirates, Dreamers, and Innovators Create and Dominate Markets) as well as considering aspects of the Product-Market Fit Pyramid by Dan Olsen and thinking a lot about differentiation and its value when bringing a new offering to market or when considering how a company’s approach to addressing a problem (existing or emerging) may warrant creating a new category.
And so, I put together the following concept to think about differentiation in my own efforts for the company I work for and thought I would share it here as well should it be useful. One note – I hope you’ll indulge me if the concept seems crazy.
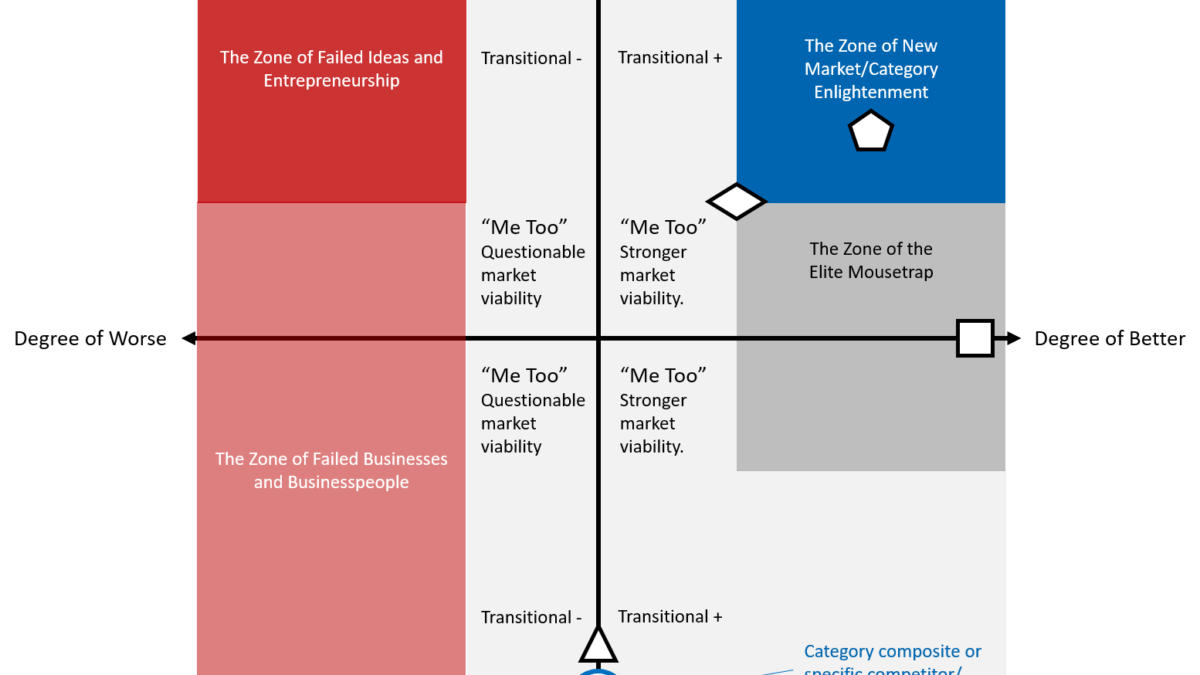
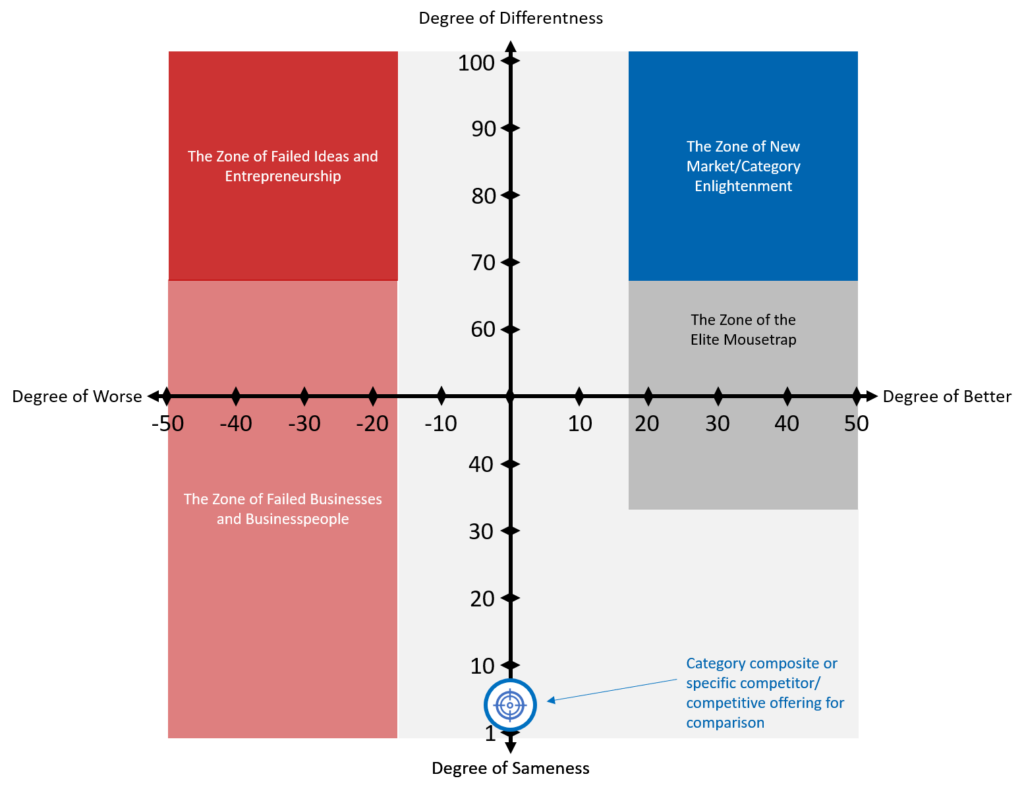
The Differentness/Sameness Matrix
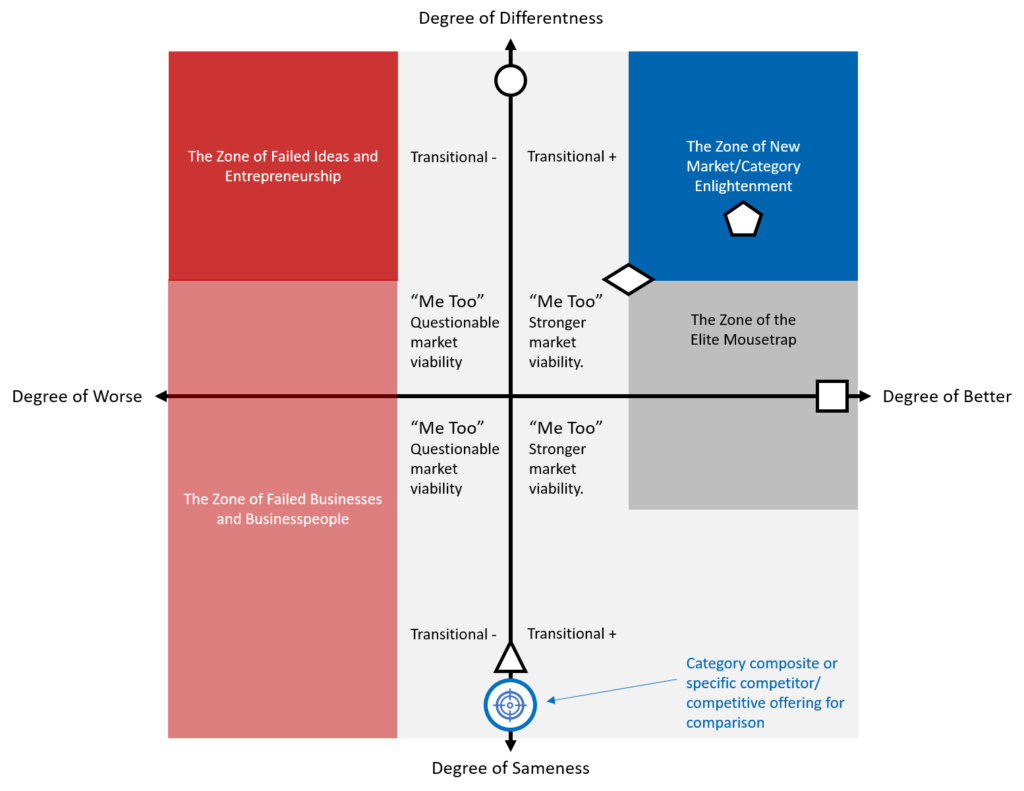
Yes, I know that “differentness” is not a legitimate word depending on whose dictionary you look at. But hang with me here anyway
The matrix is meant to give you a stronger appreciation for how you think about differentiation and where your company, its portfolio or an individual offering sit in comparison to that of a category composite, a specific competitor or competitive offering.
I define the “degree of differentness” as the degree to which a business model, technology and go-to-market approach, or an offering is unique to that of existing business models, competitive players and offerings in the existing marketplace. The higher on the y-axis, the more unique and indicative that a company is bringing an entirely new approach to solving a problem (and may be solving a problem people didn’t know they had).
I define the “degree of better” as to the added value or benefits delivered to customers by the company and/or its portfolio and offerings. For instance, if a company comes out with a better version of a widget that customers like, or delivers a better user experience than competitors.
One point to call out related to Play Bigger. Play Bigger is all about determining if you have a stronger company strategy and/or go-to-market play to make in terms of creating and dominating a new category. In many cases, the problem that the new category would solve wouldn’t be entirely known in the marketplace. So, it’s important to consider that sometimes, you have something that bends your whole thinking on fit. So, with regard to my matrix, if leaders felt – at a company level – that the company’s vision and product may be different enough and solve a problem that is only emerging versus comparing to a composite/competitor/offering, the matrix can still be used to help determine if there is the potential for category creation and a major G-T-M play, and then discuss it fully.
I really wanted to just provide a creative concept to help you appreciate more about how your company, the portfolio you manage or future individual offerings within that portfolio may or may not stand out.
 | A me-too go-to-market offering that is essentially identical to that of a competitor(s). The company shouldn’t expect sizable market opportunity with this approach. |
 | An offering that is completely different provides no better value to a customer than that provided by a competitor(s). |
 | A quantitatively or qualitatively better version to that of a competitive(s) offering in the marketplace. It stands a good chance of taking market share away from competitors in the existing category or market segment. |
 | An offering on the cusp of the existing category. Would sanction discussion on category creation versus maintaining strong positioning in existing category. |
 | An entirely different approach or solution that delivers a better outcome for target customers than the existing category. There is an opportunity for the company to position a new category and disrupt the existing market. |
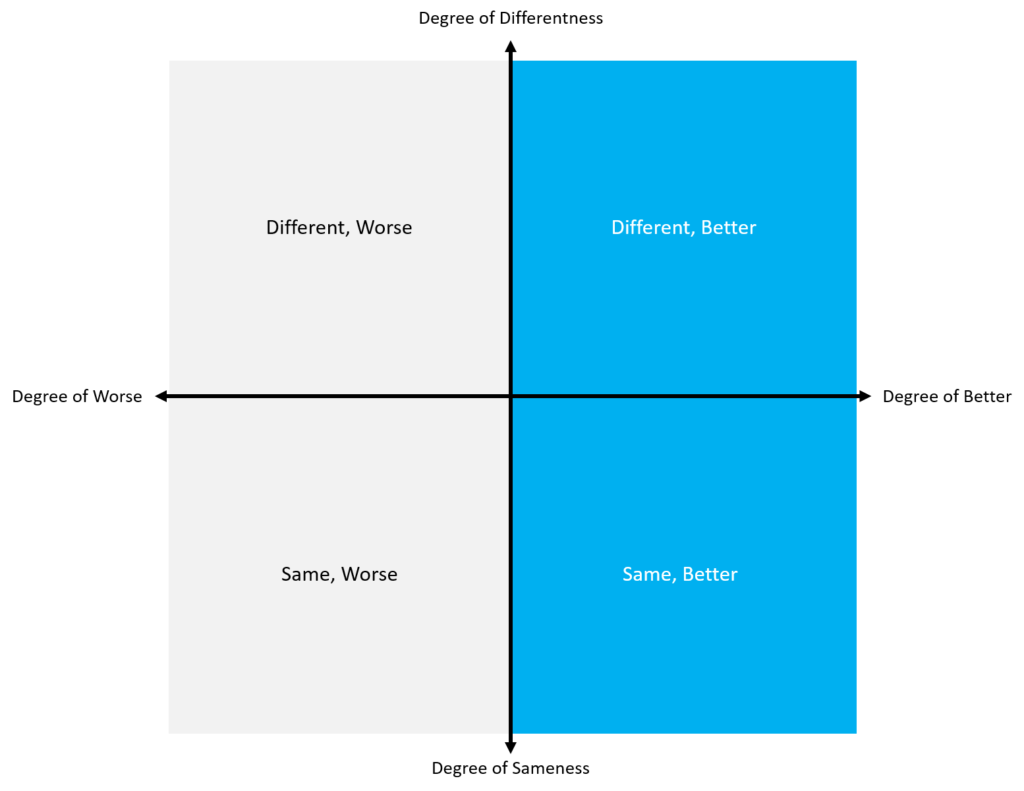
A simplified/higher level way to look at this same concept would be:
How Might You Use the Differentness/Sameness Matrix?
Now, how might you go about using the graphic above in a meaningful way? By the way, I’m a strong believer in experimenting in marketing. So, consider this an experimental approach to driving a richer discussion on differentiation.
Imagine a meeting or workshop discussion where you asked attendees to honestly rate how different they thought the company, its portfolio or individual offering is from a composite category, portfolio or offering in the marketplace. Be clear on where the focus is to the audience. And be absolutely clear for audience members to give a realistic and honest take without recrimination.
Don’t necessarily provide the charts as visuals, especially the detailed one as this might create a bias. Instead, just ask each team member to write down:
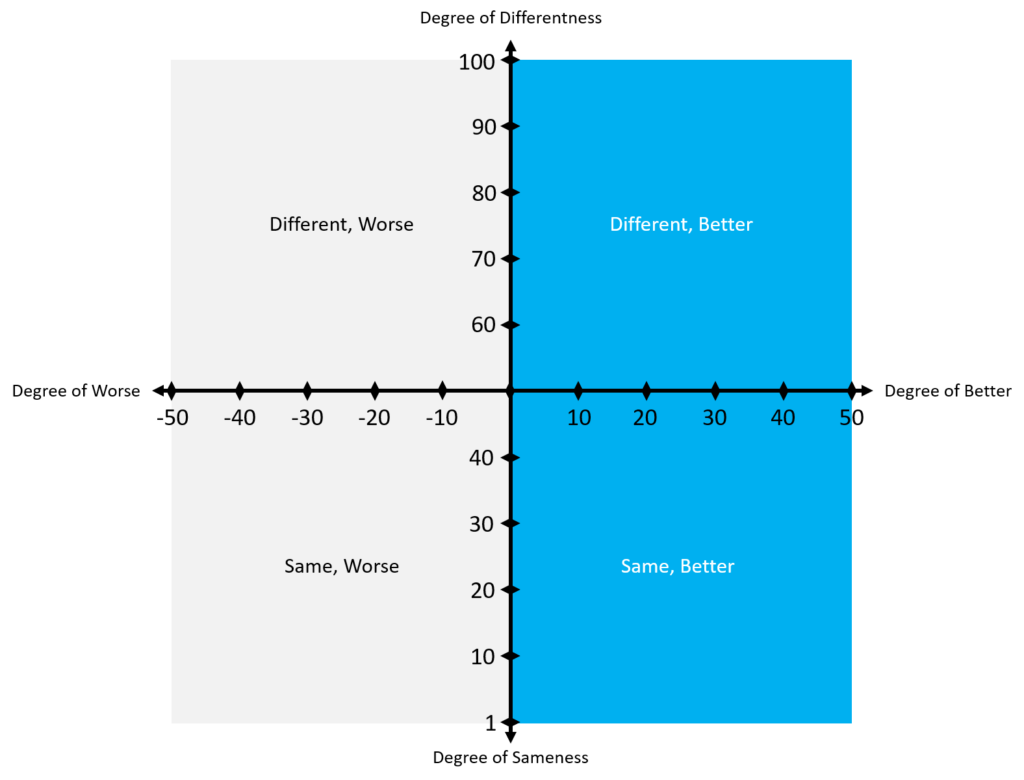
- How would you rate the degree of difference in your company’s approach/portfolio/offering versus the composite/competitor on a scale of 1 to 100 where 1 is “The exact same” and 100 is “Absolutely different.”
- How would you rate the degree of how much better your company’s approach/portfolio/offering is (the value it delivers to customers and users) versus the composite using “0” as exactly equal value to that of the composite, and 1 to 50 for better than the composite and -1 to -50 for worse or lesser value to that of the composite? If it’s easier to draw the X-axis on a whiteboard or provide it to the team, feel free to do so.
- Ask team members to write any notes down for why they ranked how they did.
- Once everyone has written down their answers, ask each member to share their rankings and reasons why. Capture this on a whiteboard, laptop or paper for everyone to see the various rankings.
- Once everyone has had a chance to share their rankings, evaluate the scores. If there is close agreement, consider averaging the scores. If there is a wide range of answers, open the discussion to talk further with the intent to get toward a consensus. Drive toward a majority consensus across the team. You may have a detractor in the mix but that’s okay. You don’t always get everyone on board. Do your best to understand why they disagree, talk it out. You may end up altering the rankings a little to bring the person on board. Or, you may need to get them to agree to disagree and commit.
- Now, show the high-level chart and map the axis points you and the group came up with.
- Now, show the detailed chart and capture the axis points again.
Discuss the placement on the chart and what it suggests. Expect this to be a longer conversation. You may want to consider whether bringing back the attendees after a day or two to discuss the results once more is worthwhile to give time for them to digest the implications. In fact, it’s not a bad idea because the results will likely invoke questions on the true value of the approach/portfolio/offering and cause some rethinking overall.
There you have it. I hope the matrix gives you just a little more perspective (not the only one out there, of course) on how you might look at and evaluate differentiation, and what could mean in terms of go-to-market considerations. If you do experiment with it, please share your experience as I’d love to hear it.

As a Product Marketer, David has successfully launched products, services, solutions and platforms across a number of disciplines in the technology industry. David’s passion for Product Marketing and his eye for seeing how Product Marketing can lead to even stronger business outcomes led him to bring his expertise and knowledge to Shoot the Curl Marketing.